IQL in Forms
In forms, IQL can be written to filter records, to change behaviors of components, or as code that is ran on click or on change.
For code version control in the IQL editor, click on the  icon to show change information by line, or click on the
  icon to show history.
Search for fields and variables used in IQL code with the Find in form tool in Form designer.
Create an Advanced filter
Once the Record filter pop-up form is opened, it’s easier to get started creating a custom filter first, and from there click on Advanced. This way you can see and learn how basic conditions are typed in IQL. After that, modify it to create your own queries.
Examples with System defined fields used as keywords/functions to filter:
createdusername = 'JSMITH'

-- This will find records created by that user
createddate >= '2019-01-01' and createddate <= '2019-01-31'
-- Will find records created during January 2019createdtime = '2019-01-01'
-- Will find records created on January 1st, 2019
createdtime >= '2019-01-01' and createddate <= '2019-01-31'
-- Will find records created during January 2019For System defined fields like createdtime and updatedtime, we recommend to use the operators < and >, or < = and >= because system fields include milliseconds, and might also those Date time fields copied from Excel, leaving the operator = not suitable to filter.
createdtime > '2024-08-14 17:49:00' and createddate < '2024-08-14 17:50:00'

-- Will find the record created at 2024-08-14 17:49:38
createdrealname("Requested by") contains 'John'
-- To filter records based on fields, in this case where the "Requested by" Text field was inserted by a user called John, regardless of other names he/she might haveupdateddate("Invoice total") = today() and "Invoice total" > 5500
-- to filter records where the "Invoice total" Number field was updated today with a value higher than 5500| System defined fields can be used as functions at Record level or at Field level. For the latter one, the field must be provided after the function within parentheses. For example, while createddate(Field) refers to the day the Field was inserted, createddate refers to the day when the record was created. |
Examples with Number fields
Price <= 5.5

-- Will display records where "Price" Number field is 5.5, 5.4, 0, -1, etc. Empty "Price" is not considered
Price is null or Price = 0
-- Records with some price will be filtered outExamples with Date fields
"Requested on" = '2017-04-18' and Customer like 'Acme'Be aware that for filters with constant values on dates, single quotation marks must be used.
"Item date" > Relation1."Order date"

-- Will find those records which "Item date" is later than the "Order date" of their parents records
DeliveryDate = today()
-- Use the today() function to compare a date with today's date. Or use now() to also get the current time"Delivery Date" > today() + 2Addition or subtraction of integer numbers together with today() and now(), represents entire days later or earlier, respectively. To specify hours for Date time fields, use a fraction of the 24-hour day, like:
"Delivery Date Time" > now() + (2/24)

-- which means the current date and time, plus 2 hours
The trunc() function can be used to convert a Date time field to a Date field, and ease the comparison, e.g.:
trunc("Approval date-time") = '2015-09-10'

-- Will find the record with the value 10-09-2015 13:24:06 in that field
For Date time fields without trunc(), we recommend to use the operators < and >, or < = and >= because they might include milliseconds (if imported or copied from Excel), leaving the operator = not suitable to filter.
"Start time" > '2024-08-14 17:49:00' and "Start time" < '2024-08-14 17:50:00'

-- Will find the record with Start time at 2024-08-14 17:49:38
Examples with Relation fields
Relation1.Text1 = 'Yes'

-- Will display those records which Parent related record has the value 'Yes' in its "Text1" field
Customer in(’C1’, ‘C2’)
-- Will result in records having "Customer" either with 'C1' or 'C2' nameExamples with File fields
File1 is null

-- For empty fields
File1 is not null
-- For uploaded filesExamples with Drop-down fields
List items are case-sensitive and must be typed within quotes.
OrderStatus in(“Closed”)List items must be separated by a comma.
OrderStatus in(“Closed”, "Cancelled")
-- For inclusion, i.e., records with OrderStatus as Closed and records with OrderStatus as Cancelled will be taken in consideration
Drop-down1" not in ("List item 1")
-- For exclusion, i.e., empty Drop-down fields are not consideredFor comparison, Drop-downs must have the same list of items assigned:
"Drop-down1" = "Drop-down2"or
Drop-down1" != "Drop-down2"Examples with Checkbox fields
Operators is null or is not null (or = true) must be used together with Checkboxes.
Delivered is not null

-- Note that Delivered = true can also be used to display ticked checkboxes
"Authorized by Manager" is nullExamples with functions
createduser = currentuser() and Relation1.updateddate = today() - 1

-- Will find records created by the current user, and which parent records were updated yesterday. Alternatively, use currentUserName(), so you can use the whole name instead of the userid, as a practical way to run queries
"Assigned username" = currentusername()userhasrole(‘Manager’) and Status=Approved
-- where Manager is a constant value, will display only records which Status is set as Approved, to users that are managers (i.e., their role is Manager)userhasrole(Customer)In the above example, Customer is a field containing a value. This will show only records that match whoever customer accesses the form; for instance, the record Order-0001 has the field Customer=ACME, and the physical customer, with user and role ACME, can access the form that displays this. For that, note that the role name must be the same as the item (in case the field is a drop-down) or the string (in case it’s a Text field). In case you are an administrator, try adding yourself to the previous filter, so the customer can see their own records, but you can see it all:
userhasrole(Customer) or userhasrole('ADMIN')userhasrole(Recordname)
-- where a function is used, in case the role is the same as the record of a table, i.e., Customer is the parent table of Order, and ACME is one of the record names of Customergeodist(latiude, longitude, latitude2, longitude2)
-- to get the distance in kilometers between two locations (i.e., records)usergeodist(latitude, longitude)
-- to get the distance in kilometers between a user and a locationusergeodist(latitude, longitude) < 100
-- To display the hotels that are within 100 km to the current user| To be able to use geodist and usergeodist, enable the geolocation setting in Role administration , and in Application settings (server level). |
Examples with strings
Text1 = upper(Text1)

-- To find text in uppercase
Text1 = string(Drop-down1)
-- To compare the item of a drop-down with a string in a Text or Note fieldText1 = substring(Text2, 0, 2)
-- Would find "ABC" in Text1 within ABCDE stored in Text2Examples for interrelated sections
You may use the key variable @limitByValue to customize any kind of relation between sections.
@limitByValue is very useful in combination with the Limitation field: Use custom IQL condition for fixed filters.
To show unrelated records between connected sections (in a model like Child → Parent, where Parent is the main section and Child the limited one):
RelationToParent != @limitByValueTo show records in a many-to-many relation (in a model like TableA ← LinkTable → TableB, where TableA is the main section and TableB is the limited one):
RecordName in (RelationToTableB from LinkTable where RelationToTableA = @limitByValue)To show grandchildren records (in a model like Table3 → Table2 → Table1, where Table1 is the main section and Table3 is the limited one):
RelationToTable2 in (Recordname from Table2 where RelationToTable1 = @limitByValue)Another example for grandchildren records:
Parent in (Child from Parent where recordid = @limitByValue)For forward relation:
RelationToTableB.RelationToTableA = 'A1'

-- will show the records related to the Parent records which have A1 as parent record (i.e., 2 levels above the current table)
For Parents with no Child records:
recordname not in (ParentRelationField from Child where ParentRelationField is not null)For reverse relation:
recordid in (RelationToCustomer from Order where ApprovedCheckbox is not null)

-- it will show the customers that have any order being approved, i.e., from Customer (parent table) the Orders (child table) are reviewed to see if the condition matches
Another example when limited by Child record:
RecordId in (RelationToParent from ChildTable where RecordId = @limitByValue)For active record limitation, use:
RecordId = @limitByValueFor filtering records in an array selected in Table section:
RecordId in @limitByValues

-- Note that @limitByValues is a key variable
-- @limitByValues can only be compared with RecordId and Relation fields|
For filters, note that Relation and Text fields can be compared with both: However the TIP: If you are unsure when to use |
More examples for interrelated sections
For a many-to-many relation:
recordid in (Actor from Role where Movie = 'Life is beautiful')

-- Will show the actors in that movie
recordid in (Movie from Role where Actor = 'Woody Allen')
-- Will show the movies where that actor had a role inAnother example for the above, is:
recordid in (Relation1 from LinkTable where Relation2 = @limitByValue)Records having the same parent:
Parent = (Parent from Child where recordid = @limitByValue)Examples with variables
Note that variables can be used to configure fixed Advanced filters, i.e., via the Filter IQL editor in Form designer only, and not for the Advanced filters via the Record filter in rendered forms.
Date1 = @myDate

--Will result in a number of records that have Date1 equal to whatever value is stored in @myDate
RecordName in (Relation from Table where RecordName = @rn and Date = @dt)RecordId in @array
or @array is null
--Once an array is collected, you can use it to filter sections
Note that variables used in filters have no data type and may require the use of functions to work. For example, the variable @phone, declared as set @phone = NumberField in a Run on select editor will fail if you use it in a filter to compare it with a Text field, like this: TextPhone = @phone. In this case, you must use a function to parse it as string:
|
TextPhone = string(@phone)Change the behavior of components
Most components in Forms have behaviors that can be adjusted with IQL. In this section we will walk through the possible changes in behavior.
|
If you involve fields from a parent relation in |
:backgroundColor
The :backgroundColor property is used to change the background color of a component. The color is represented by the Name or the Hex-code of the color in a string format.
Syntax
set :backgroundColor = 'Color'The following example sets the background color of a component to yellow.
Example 1
set :backgroundColor = 'yellow'Example 2
set :backgroundColor = '#FFFF00'Example 3
Change a field’s backround:
If the amount of items received is lower than the expected, then this field will turn red. For that, select the "Expected quantity" Number field and for its Behavior, type
if "Actual quantity" < "Expected quantity" then
    set :background = 'red'
end
:backgroundColor must be used in combination with @series for Bar chart, and @series or @value for Pie chart and Table chart.
|
:disabled
The :disabled property is used to disable buttons. To disable the component, set :disabled to true or 1. To make the component visible, set :disabled to false or 0.
Syntax
set :disabled = booleanor
set :disabled = binaryExample 1
Disable a button if the current user doesn’t have ADMIN as a role.
set :disabled = not userhasrole('ADMIN')Example 2
Disable a button depending on the value in a Note field:
If the warehouse receives a package that is marked as dented, a button called "Ready" will be disabled until a description of the damage is provided.
if "Description of the damage" is null then
    set :disabled = 1
end
:caption
:caption is used to display a value on Label, Button, Panel and Link components. The value may be a string, field value, variable, function or calculated value.
Syntax
set :caption = <value>Example with strings
The string must be typed within single quotes.
set :caption = 'Hello world'If you need to render single quotes within the string value, then use two consecutive single quotes (besides the required ones), like this:
set :caption = 'Hello world ''-'' We come in peace'Which would render like Hello world - We come in peace
To set an empty string:
set :caption = ''Examples with field values
set :caption = TextFieldset :caption = NumberFieldset :caption = nvl(NumberField, 0)set :caption = formatNumber(NumberField, '$ 0,0')Examples with variables
set :caption = @variableThe use of :caption cast variables as strings.
set :caption = 'The estimated time of arrival is:' || @shippingETA
Note that variables used in Behavior have no data type (other than string cast with :caption) if they are declared outside the Behavior editor, and may require the use of functions to work. For example, the variable @myDate, declared in a Selector’s IQL editor as _set @myDate = DateField, would not work correctly if used in a Label’s IQL editor as set :caption = @myDate + 1 since it ignores that the variable is a date with an extra day. In this case, the variable will require the use of functions to parse and format the value as a date, like this:
|
set :caption = parseDate(formatDate(@myDate,'YYYY-MM-DD'), 'YYYYMMDD') + 1Which would result like "2026-07-19T00:00:00", as the formatDate() function was required to use the parseDate() function, but not used yet to format a date. You may use an additional formatDate() function to give format to the parsed date:
set :caption = formatDate((parsedate(formatDate(@myDate,'YYYY-MM-DD'), 'YYYYMMDD') + 1),'YYYY-MM-DD')Resulting now in "2026-07-19".
Examples with functions
set :caption = 'Welcome ' || currentUsername()set :caption = today()Which will return, for example 2026-01-01T00:00:00
set :caption = formatDate(today(), 'YYYY-MM-DD')Which will return instead 2026-01-01
Examples with calculated values
set :caption = NumberField1 + NumberField2set :caption = formatNumber(nvl(NumberField1,0) * nvl(NumberField2,0), '£ 0,0')Note that aggregation functions like sum(), count(), etc., are not supported in :caption. However, you may use a variable that previously stored such a result.
|
Use Label component with |
Example with condition to toggle the caption of a Button
if Subtotal < 0 or Subtotal > Budget then
    set :disabled = 1
    set :caption = 'Subtotal is out of range by ' || Budget - Subtotal
else
    set :caption = 'Submit the form'
end
Note how concatenation is supported with ||.
:caption must be used in combination with @series for Bar chart, Line chart, and Pie chart.
|
:imageUrl
:imageUrl is the only function available for Media component. The URL must be typed within single quotations.
Syntax
set :imageUrl = 'URL'Example
Display a default image:
For Media component, display a specific picture after choosing a certain item in a Drop-down, or typing a certain value in a Text field, e.g., if you choose “Vehicle inspection”, the template picture of a car will be shown, ready to make marks on it; but if you choose “Excavator inspection”, then the template will change accordingly.
if "Type of inspection Drop-down" in ("Vehicle inspection") then
    set :imageUrl = 'https://picsum.photos/200/300'
else
      if "Type of inspection Drop-down" in ("Excavator inspection") then
        set :imageUrl = 'https://source.unsplash.com/WLUHO9A_xik/1600x900'
      end
end
:hidden
The :hidden property is used to hide components. To hide the component, set :hidden to true or 1. To make the component visible, set :hidden to false or 0.
Syntax
set :hidden = booleanor
set :hidden = binaryThe following example hides a component if the current user doesn’t have ADMIN as a role.
Example
set :hidden = not userhasrole('ADMIN')|
Use |
:readOnly
The :readOnly property is used to set the writing properties of a component. To make a component only readable set the :readOnly property to true or 1. To make it able to write in the component, set :readOnly to false or 0.
Syntax
set :readOnly = booleanor
set :readOnly = binaryThe following example enables writing in a component for all users with ADMIN as role and disables writing for every other user.
Example
set :readOnly = not userhasrole('ADMIN'):text
Use :text to format the value in cells of Table charts. Must be used in combination with the @value key variable.
Syntax
set :text = formatNumber(@value, 'format'):textColor
The :textColor property is used to change the background color of a component. The color is represented by the Name or the Hex-code of the color in a string format.
Syntax
set :textColor = 'Color'The following example sets the background color of a component to blue
Example
set :textColor = 'blue'or
set :textColor = '#0000FF':x / :y
Use the :x and :y properties to set the position of a component. Note that this position is relative to the Parent of the component; for example, a Button with a position x:0 and y:0 will appear at the top left of the form is placed on the form root, but it will appear on the top left of a section if placed inside of it.
Syntax
set :x = 10
set :y = 10
:height / :width
Set the dimensions of components with these properties:
Syntax
set :height = 200
set :width = 200
:borderColor
Highlight your components adding some color to their borders:
Syntax
set :borderColor = 'blue'or
set :borderColor = '#0000FF':icon
The :icon property is used to choose an image for a Button or Icon component from our collection, found in the Icon property. For that, simply type within single quotes one of the registered icons.
Syntax
set :icon = 'Floppy-disk':sortKey
Use :sortKey to sort split legends for Bar Chart and Line Chart.
Syntax
set :sortKey = lower(@series):tooltip
You can add a text that pops up when users hover over a component by using this property:
Syntax
set :tooltip = 'This is the total amount authorized by Finance':rangeMin / :rangeMax
Only used with the Meter component, these properties set the minimum and maximum value of the range to be displayed.
Syntax
set :rangeMin = 0
set :rangeMax = 100
As an integrated example of the above descriptions, let’s say we have a Button component that is toggled to accomplish two different actions, and upon each of them the behavior will change accordingly, making it look like two different buttons:
set :caption = 'Filter by last week'
if @variable = 1 then
    set :width = 200
    set :height = 20
    set :borderColor = 'yellow'
    set :icon = 'Filter'
    set :caption = 'Show all'
    else
        if @variable = 2 then
            set :width = 100
            set :borderColor = 'green'
            set :icon = 'Filter-slash'
            set :caption = 'Filter by last week'
        end
end|
Heavy usage of IQL Behavior may impact performance in the form. This is because properties set using Behavior are continously evaluated whilst the form is open. |
Run actions with components (Run on click, Run on change)
Run an action or multiple actions at one click of a Button, Link or Icon, or upon change of a field value; for example, an action to save the form, to open another form, to take a photo, etc., using the Run on click or the Run on change IQL editors.
Start typing any statement you need, for example, save to quickly filter the available statements having that word. Then select or hit Enter to add it.
You can also display all the statements by hitting Ctrl+Space:
Collect an array
There are two ways to collect an array: based on selection and based on a query.
-
Collect an array based on selection. Once the "Selection checkboxes" property is set in a Table section, type the following code in the
Run on selecteditor of the Table section:set @tableSectionArray = @selectedRecords -- Note that @selectedRecords is a key variable -- @selectedRecords will only store RecordId fieldsThen, use that array to perform actions based on its records or to filter sections.
Example 1. Set values in the array records
In the
Run on clickof a Button (targeting the Table section), use thefor loopcommand to tick the "Approved" Checkbox in every record of the Task table collected in the array, for example:for Task @tableSectionArray do set Approved = true endExample 2. Create a record per array record
If you wish to create a record per record of the array, use the
foreachloop command instead, useful for cases where you have multiple levels within the same table, in combination with thecollectcommand to retrieve the RecordName fields in the original array. Let’s say, the Project table that has a relation to itself, to manage tasks associated to projects. In this case, the code could create a task per project in the array, inheriting the name after the project with a suffix, and associating the respective project. For that, you first need to modify theRun on selecteditor like this:let @tableSectionArray = @selectedRecords -- Note that @selectedRecords is a key variable -- @selectedRecords will only store RecordId fields set @arrayWithRecordName = collect Recordname from Project where RecordId in @tableSectionArray -- This line defines a new array that collects the Record names from the Table section array.Then, in the
Run on clickof the Button (targeting the Table section), use theforeachcommand:foreach @record in @arrayWithRecordName do call create() call save() -- You must save first to then customize the RecordName set RecordName = @record || '-Task' set Project = @record end -- The variable @record can be named in any way, but it's for the exclusive use of the "foreach" loop. call save()Example 3. Filter a section based on the array records
In the
FilterIQL editor of a section (limited by the Table section with the "Selection checkboxes" property and "Use custom IQL condition" as "Limitation field"), type the following:RecordId in @limitByValues -- Note that @limitByValues is a key variable -- @limitByValues can only be compared with RecordId and Relation fields -
Collect an array based on a query. From any
Run on clickeditor you can type:set @array = collect <Field> from <Table> where <Condition>Example
Let’s return to Example 1 above, where you wish to check the "Approved" box of certain Task records at once, but this time you collect those records by manual selection, but by using the following query in the
Run on clickof a Button (targeting a section where Task is the Datasource):set @array = collect RecordId from Task where Status in(Completed) for Task @array do set Approved = true endAccording to how IQL is evaluated, you will need to click twice: first to collect, and then to approve. To make a logical flow to this, let’s add the following code to the
Behavioreditor of the Button:if @array is null then --This will be the original name of the Button set :caption = 'Review completed tasks' else --Once the array is collected, this name will appear set :caption = 'Approve tasks' endThen, to make sense to "Review completed tasks" shown at the Button, we can use the array to filter the section in question. For that, type this in its
Filtereditor:RecordId in @array -- To filter according to the records in the array or @array is null -- To show all records when the form is openedAs an alternative, you could place the
collectcommand elsewhere, for example, in theRun on selectof a Selector or in theRun on changeof the "Status" Drop-down, to then enable the button to set the value in the Checkbox.
Save the active record
|
This action, in combination with a Button placed on the form root and a Repeater as Target section, works to save all edited records. |
Select a file for upload
|
In case the Button, Icon, or Link component is placed outside the section, the property Target section must be provided. |
|
The regular "Action" property available for Button, Icon, Link and Media component in Form designer does not work together with |
|
Be aware that the Button, Icon, or Link component configured to do IQL actions having a Table section as source, will only work for the selected record. For example, a Button is expected to create a new record assigning the Record group of the Parent record, with the following IQL on If no row is selected in the Table section, no Record group will be set, because there is no data reference. |
|
To enforce that the user selects a row before clicking on the Button/Icon, you could set a In combination with Configuration could become more complex in case you also want to make sure that the last selected row belongs to the newly selected Parent record, where a new variable would have to be set on the Parent table as well, and included in the Button/Icon Behavior. |
Run calculations on fields or set the value of fields (Run on change)
Get the result of a formula immediately after changing values in your form, without having to save or click on a button. This can be done thanks to the Run on change property. For example, select the "Quantity" field, go to its property Run on change and type:
set Total = Price * Quantitywhere "Total" will be automatically updated every time "Quantity" changes. But be aware that "Price" might also change, so in this case, both factors (fields "Price" and "Quantity") would have to add the same IQL code in their Run on change IQL Editor.
|
Select multiple fields to apply the same code in IQL editor, i.e., you can edit all fields involved at the same time. |
Another example is:
set Text = Relationwhere "Relation" is the recordname of the Parent table. The syntax set Text = Relation.recordname is also supported.
|
Be aware that using Run on change to get data from a Parent table via Relation field, supports only its record name one level up on the direct relation. For example, is supported, but or is not. To accomplish this, there are two alternatives:
|
|
With Run on change, you can use most of the functions described in other sections within this topic. For example, if-else, call save(), set variables, trunc, parsedate, substring, etc. |
Example using Run on change with functions:
if "Work status" in(Started) then
set "Worklog notes" = 'Work started on ' || now() || ' with provider ' || nvl(Provider, ' not available yet') || chr(10)
endIn this example, Run on change is on a Drop-drown called "Work status" that once it changes to "Started", the Note field "Worklog notes" concatenates strings, today’s date and time and the Relation field "Provider", which uses an nvl function to add a string in case it is null, i.e., the result could be "Work started on 06-04-2023 08:30:00 with provider ACME", or could be "Work started on 06-04-2023 08:30:00 with provider not available yet", in case Provider was null.
Another example, simpler, with nvl would be set
"Unit price" = nvl("Unit price", 0)to replace empty prices with a 0 instead.
Note how the function chr(10) was used into the concatenation to add a new line after the resulting string. In the given example, having it after now(), would result in:
Work started on 06-04-2023 08:30:00 with provider ACME
Run on change may also be used to customize the name of a File.
For comparison between Date and Date time fields, use the days function to return the result into a Number field. In the examples below, let’s say that the actions would occur upon Run on change on dates:
Example 1
set "Task duration" = days("Start date", "Finish date")Example 2
set "Hours worked" = days("Start date time", "Finish date time") * 24Example 3
let @actualDuration = days("Actual Start", "Actual End")
let @plannedDuration = days("Planned Start", "Planned End")
set "Actual VS Plan deviation percentage" = (@actualDuration - @plannedDuration) / @plannedDurationIn this case, we recommend to set the Number format "0 %" in Form designer to the "Actual VS Plan deviation percentage" Number field.
Example 4
set @projectTotalDurationDays = (sum(days("Start Date", "End Date")) from Task where Project = @project)In this case, the variable @projectTotalDurationDays is being displayed in the form as a Number field together with a label "Accumulative duration for the selected Project", which will change at running time upon updating a Task Date. Note that the @project variable may be defined on Run on select of the Project section as set @project = RecordName, or in this query as first line as let @project = Project.
Run actions upon selection of a Record (Run on select)
Whenever you use the Selector, Detail section, Multi detail section, Table section, Map, or Calendar, the Run on select property will be available for you to apply an IQL action. This property is especially useful to define variables that will later be used somewhere.
Example 1
In your form, you have a Record Selector and a related Detail section showing Projects. But you also have a Table section showing Inventory, that has no relation with Project, but you wish to limit the Inventory where the Client matches the Project’s Client.
For that, in the Run on select of the Selector or the Detail section of Project, type:
set @client = ClientThen, in the Table section of Inventory, use that variable in its Filter property, as follows:
Client = @clientAfter that, navigating through Projects will refresh the Inventory section accordingly.
Example 2
Let’s say that you have a form where you show the detail of an "Inspection" record, but you want to hide or show the Panel "Electrical" depending on if this aspect (defined in a drop-down) is applicable to the selected inspection.
For that, in the Run on select of the Selector or the Detail section type:
if "Is Electrical inspection applicable?" in(Yes) then
set @electricalPanel = 1
else
set @electricalPanel = 0
endThen, in the Panel in question, you will use that variable to modify its Behavior, as follows:
set :hidden = @electricalPanel != 1Note that navigating through records will show or hide the Panel accordingly, but if the user is allowed to change the drop-down in the form, then the same variable should also be defined in the Run on change of that drop-down.
Example 3
The "Inspection" is related to "Project". And the latter, related to "Client", i.e., a direct relation Inspection→Project→Client. There is a need of a form with a Table section displaying all inspections, but with a Selector on top, with the list of clients that can work as a filter for our Table section.
For that, in the Run on select of the Selector, type:
set @client = RecordNameThen, in the Table section, you will use that variable in the Filter, as follows:
Project.Client = @clientExample 4
You wish to display data of the "Service area" based on the selection of either a "Duct", a "Cable" or a "Conduit" located in a Map.
For that, in the Run on select of each Map layer of the Map component, type:
set @serviceArea = "Service Area"Then, in the Selector or Detail section with "Service Area" as Datasource, you will use that variable in the Filter, as follows:
RecordName = @serviceAreaExample 5
You can collect an array based on a manual selection. Once the "Selection checkboxes" property is set in a Table section, type the following code in the Run on select editor of the Table section:
set @tableSectionArray = @selectedRecords

-- Note that @selectedRecords is a key variable
-- @selectedRecords will only store RecordId fieldsIf you need to collect other type of field other than RecordId, then use the following code in Run on select:
let @tableSectionArray = @selectedRecords

-- Note that @selectedRecords is a key variable
-- @selectedRecords will only store RecordId fields

set @arrayWithRecordName = collect Recordname from Table where RecordId in @tableSectionArray

-- This line defines a new array that collects the Record names
   from the Table section array.
Read about the actions you can do with an array here.
Example 6
You can collect an array based on the following query in the Run on select editor:
set @array = collect <Field> from <Table> where <Condition>Let’s say that you wish to collect the Tasks belonging to the selected Project. For that, in the Run on select editor of the Project Selector, type:
let @project = Recordid

set @arrayTasks = collect RecordId from Task where Project = @project
After that, you could use the array to, for example, set "Status" = "Cancelled" in all the Tasks in the array whenever the Project is cancelled.
Read about other actions you can do with an array here.
|
Preferably, try to avoid it would result in a form constantly waiting to be saved. Instead, you could use that IQL in a |
Look for another example of how to open a form that will change its appearance depending on more that one variable, using Run on select, in our Tips and Tricks topic.
|
Be aware that using Run on select to get data from a Parent table via Relation field, supports only its record name one level up on the direct relation. For example, is supported, but or is not. To accomplish this, define instead those related values with a local variable making reference to the Relation fields, and then a global variable using a query with |
Even when you can use Run on select in combination with almost all IQL functions, we highly recommend you to avoid using it to set values on fields; for example, a query like set Client = 'ACME' would make the form permanently waiting to be saved. Even if you add a call save() afterwards, it would be a constant resource spent to save at every selection of the user. Instead, a better practice is to have these actions in a Button or upon changing a field.
|
Run actions upon loading the form (Run on init)
Sometimes it is necessary to set up some variables from the moment the form is opened, which will be later modify by the user depending on actions from other components.
For example, let’s say that you have a form with a Table section showing Projects. At the top of form, you have two Buttons: "Active" and "Inactive" which, if clicked, will filter the Projects by Status Active or Status Inactive, or both of them. But regardless of what the user clicks, you wish to show them only Active Projects by default when opening the form. For that, select the canvas of the Form, click on Run on init and type the following:
set @active = 1
set @inactive = 0
After that, you can then set up the Behavior. In the "Active" Button:
if @active = 1 then
    set :backgroundColor = 'limegreen'
end
In the Behavior of "Inactive" Button:
if @inactive = 1 then
    set :backgroundColor = 'limegreen'
end
In the Run on click of the "Active" Button, you could type this query to toggle it:
if @active = 1 then
    set @active = 0
else
    set @active = 1
end
Do the same for the "Inactive" Button.
Then, in the Filter of the Table section, type:
-- To display only Active
(Status in(Active) and @active = 1 and @inactive = 0)
or
-- To display only Inactive
(Status in(Inactive) and @inactive = 1 and @active = 0)
or
-- To display both Active and Inactive
(Status in(Active,Inactive) and @active = 1 and @inactive = 1)
or
-- To remove the filter. This might show othe Status, if available
(@active = 0 and @inactive = 0)
Configure charts components (IQL chart)
Add the IQL chart component onto the canvas, and then open the Form rules block. In Chart query, type code with the following syntax:
"Field 1", -- Refers to x-axis, can use function, can be a label
"Field N" -- Refers to y-axis, can use function, can be more than one separated by comma
from Table
where Condition -- Optional
group by Field -- Optional unless aggregation function is used on axis, can be more than one separated by comma
order by Field -- Optional, can be more than one separated by comma
The condition may include a dependency on another section via the Limited by property of the selected chart, together with the @limitByValue key variable in the code, like this:
"Field 1",
"Field N"
from Table
where "Relation field" = @limitByValue
group by Field
order by Field
Line chart examples
Line chart with simple query
RecordName,
"Total sold"
from Sales
where "Sale date" is not null
and "Sale date" < today()
order by Recordname
If you only have one field for the y-axis, we recommend that you use the Y-axis label property for the selected chart, for instance "Total sold value", as the resulting chart legend will only appear for two or more series.
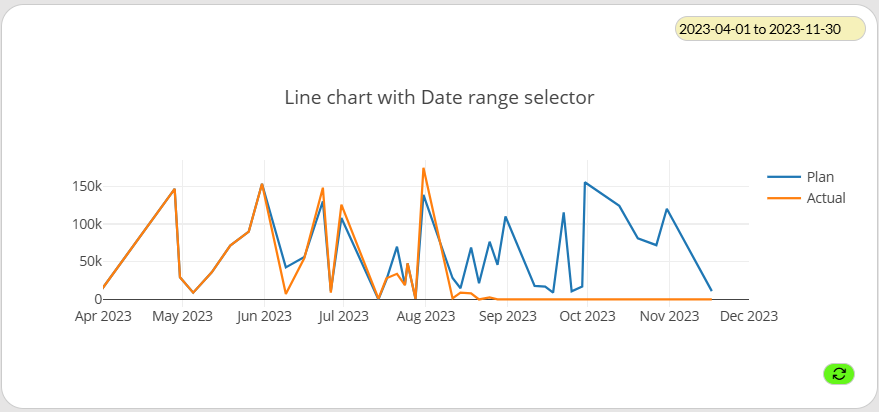
Line chart with Date range selector
When using a Date field as x-axis, as in the example below, you may use the Date range selector property of the chart, to be able to filter through periods of time. For that, set the X-axis type property as "Time series" and the Date range selector interval as well.
Date,
sum("Plan"), sum("Actual")
from Activity
group by Date
order by Date
To change the legend for the fields in the y-axis, select each of them and use the Caption property, e.g., "Plan" and "Actual", to avoid displaying sum("Plan") and sum("Actual") on the rendered form.
To change the color of the lines, select each y-axis series and use the Style properties.
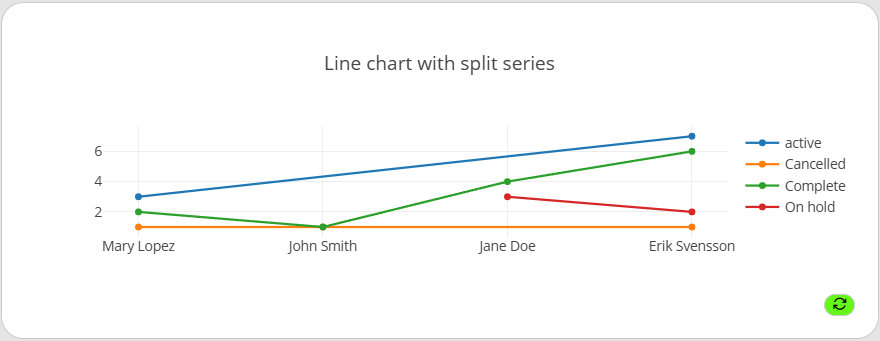
Line chart with split series
Some charts will require to split series to show the y-axis. For example, you want to show how many orders the officers have per status. The latter is a Drop-down with a list of values. For that, set the Split series by property to "WorkOrderSatus" after typing this as Chart query:
Officer,
WorkOrderStatus, count(1) -- 1 refers to field #1, i.e., the count of Officers
from WorkOrder
group by Officer, WorkOrderStatus
order by Officer desc -- Descendant sorting
To sort the items on the legend of the resulting Line chart, and to customize a caption, click on the data series that have aggregation function in the y-axis, i.e., "count(1)", and in its Behavior editor type:
set :sortKey = lower(@series)

/*
Let's say that your chart will be split by the status
"Cancelled", "Complete", "On-Hold" and "active".
In this case, the chart will place "active" at the
bottom of the y-axis legend due to default sorting, but
:sortKey as lower will make the case insensitive.
*/

if @series = 'On-Hold' then
  set :caption = 'On hold' -- Custom caption
end
:sortKey can only be applied to data series with aggregation function for Line and Bar IQL Charts that have split series.
|
Bar chart examples
Bar chart with simple query
RecordName,
"Total sold"
from Sales
where "Sale date" is not null
and "Sale date" < today()
order by Recordname
If you only have one field for the y-axis, we recommend that you use the Y-axis label property for the selected chart, for instance "Total sold value", as the resulting chart legend will only appear for two or more series.
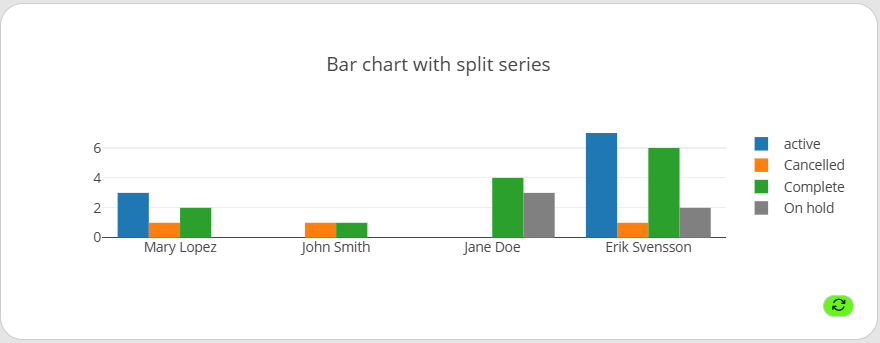
Bar chart with split series
Some charts will require to split series to show the y-axis. For example, you want to show how many orders the officers have per status. The latter is a Drop-down with a list of values. For that, set the Split series by property to "WorkOrderSatus" after typing this as Chart query:
Officer,
WorkOrderStatus, count(1) -- 1 refers to field #1, i.e., the count of Officers
from WorkOrder
group by Officer, WorkOrderStatus
order by Officer desc -- Descendant sorting
To sort the items on the legend of the resulting Bar chart, customize a caption, and change the color of a bar, click on the data series that have aggregation function in the y-axis, i.e., "count(1)", and in its Behavior editor type:
set :sortKey = lower(@series)

/*
Let's say that your chart will be split by the status
"Cancelled", "Complete", "On-Hold" and "active".
In this case, the chart will place "active" at the
bottom of the y-axis legend due to default sorting, but
:sortKey as lower will make the case insensitive.
*/

if @series = 'On-Hold' then
  set :caption = 'On hold' -- Custom caption
  set :backgroundColor = 'gray' -- Custom color for bar
end
:sortKey can only be applied to data series with aggregation function for Line and Bar IQL Charts that have split series.
|
Bar chart with Label as x-axis
In case you don’t need to display any field as x-axis, but just the series of the y-axis.
'Summary', -- Can be '' or any string within single quotes
sum(Number1), sum(Number2)
from Table1
To change the legend for the fields in the y-axis, select each of them and use the Caption property, e.g., "Total Number 1" and "Total Number 2", to avoid displaying sum(Number1) and sum(Number2) on the rendered form.
To change the color of the bars, select each y-axis series and use the Style properties.
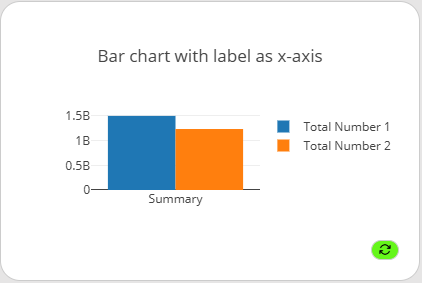
Table chart examples
Table chart with simple query
RecordName, -- first column
"Total sold" -- second column
from Sales
where "Sale date" is not null
and "Sale date" < today()
order by Recordname
The first column will not display header. The headers of the y-axis series can be changed via Caption property as long as the series is not to be split, so in this case it is possible to name "Total sold" to something else.
|
Optionally, to change the color of a cell and set a format to the value, click on the y-axis series, and in its Behavior editor type:
if @value < 10 then -- To color of cells upon condition
  set :backgroundColor = 'red'
end

set :text = formatnumber(@value, '£ 0,0.00') -- To format the value| The @value key variable can only be applied to y-axis series for Table charts. |
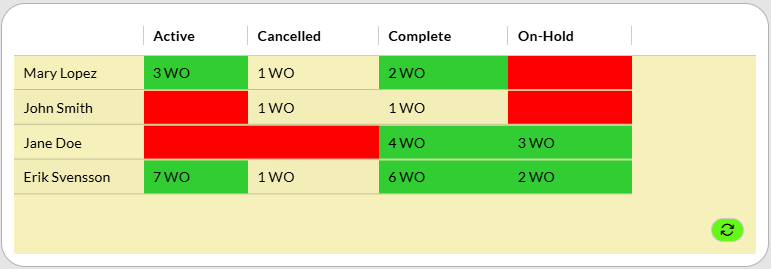
Table chart with split series
Some charts will require to split series to show the y-axis. For example, you want to show how many orders the officers have per status. The latter is a Drop-down with a list of values. For that, set the Split series by property to "WorkOrderSatus" after typing this as Chart query:
Officer,
WorkOrderStatus, count(1) -- 1 refers to field #1, i.e., the count of Officers
from WorkOrder
group by Officer, WorkOrderStatus
order by Officer desc -- Descendant sorting
Set the Merge values using property of the selected chart to "First", so that the values in the x-axis can be grouped, i.e., Officer.
Optionally, to change the color of a cell and set a format to the value, click on the data series that have aggregation function in the y-axis, i.e., "count(1)", and in its Behavior editor type:
if @value is null then
  set :backgroundColor = 'red' -- conditional color
else
  if @value > 1 then
    set :backgroundColor = 'limegreen'
  end
end

set :text = formatnumber(@value, '0,0 WO') -- To format the value with thousand separator and suffix
The @value key variable can only be applied to y-axis series for Table charts.
|
The first column will not display header. The headers of the y-axis series can be changed via Caption property as long as the series is not split.
|
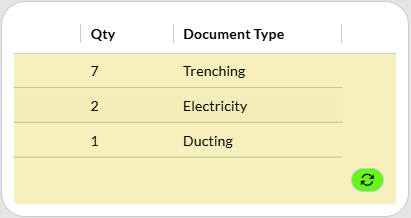
Table chart with Label as x-axis
In case you don’t need to display a first column (x-axis), but just the series of the y-axis. For example, a table with the count of documents per type:
'', -- x-axis, i.e., first column will look empty
count(RecordName), "Document Type" -- y-axis data series
from Document
group by "Document Type"
order by 2 desc -- Descending sorting on the count values
To change the legend for the count column of the y-axis, select it the Caption property, e.g., "Qty", to avoid displaying count(RecordName) on the rendered form.
Pie chart examples
Pie chart grouped by Checkbox
"Approval Checkbox",
count(RecordId)
from Activity
group by "Approval Checkbox"
In this case, note that the legends of the rendered chart will be "null" and "true", as the "Approval checkbox" is a boolean. To change the captions of the legend and customize color, click on the data series that have aggregation function in the y-axis, i.e., "count(RecordId)", and in its Behavior editor type:
-- Conditional caption and color based on series
if @series is null then
  set :caption = 'Not approved'
  set :backgroundColor = 'red'
else
  set :caption = 'Approved'
end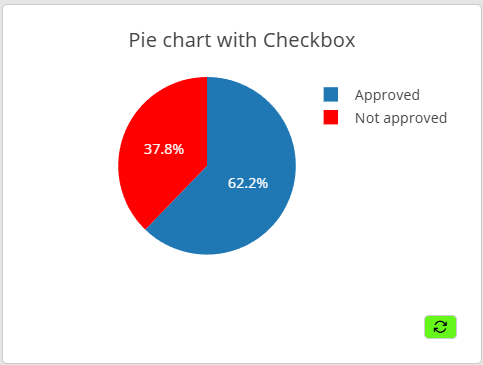
Pie chart grouped by Drop-down
"Project Type",
count(RecordId)
from "Issue"
where "Project Type" is not null -- To avoid displaying "null" legend
group by "Project Type"| It is a good practice to use the condition is not null when configuring charts to avoid unexpected results in case there are empty values. |
Let’s say that the "Project Type" values have a long caption, and we just want to display the first 3 letters. To change the captions of the legends and customize color, click on the data series that have aggregation function in the y-axis, i.e., "count(RecordId)", and in its Behavior editor type:
-- Conditional color based on data
if @value > 50 then
    set :backgroundColor = 'pink'
end

-- Custom caption for all series
set :caption = substring(@series, 1, 3)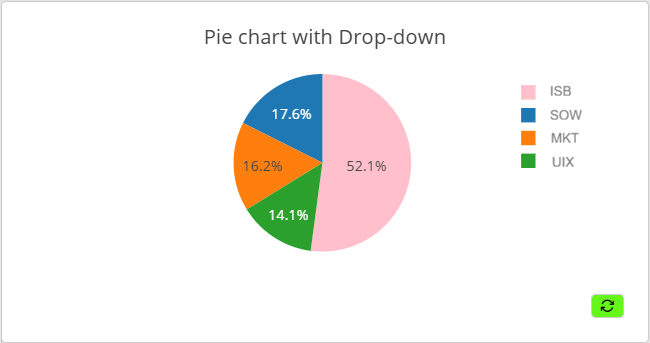
Order in IQL charts
The data in the chart is fetched with an IQL query. The data is placed in the chart in the same order as the data is fetched in the query. For example, in a line chart, the line is drawn in the same order as the data is retrieved. Therefore, it’s important to specify the order in which the query is executed.
Example
Date, Value
from Table
order by Date
It is possible to order a query by more than one field. In the example below, when multiple records share the same Date, they are then sorted by Recordname.
Example
Date, Value
from Table
order by Date, Recordname
To order by a function, read the following topic.
Functions in IQL charts
In a chart, it is often preferable to display a value derived from an aggregation function, e.g., min(), max() and avg(). In these cases the query needs to be grouped by the wanted field and ordered by an ordinal.
Example
This IQL-chart displays the average, and median temperature for each month ordered by month.
Month, avg(Temperature), median(temperature)
from TemperaturePerDay
group by Month
order by 1|
The first parameter holds the index 1. |
Example
This IQL-chart displays the latest date of an activity being carried out. For that, the max function is used for a Date field, which is then referred as index "2" to sort the chart.
"Activity type",
max("End date")
from Activity
group by "Activity type"
order by 2